


 About Us
Our Authors
Us In The Media
Links to Data
I'm New To This Site
Contact Us
About Us
Our Authors
Us In The Media
Links to Data
I'm New To This Site
Contact Us |

|
 |
You are logged in as stevemcintyre
|
 |
|
Faking that NASA faked the moon landing
 | By Stephan Lewandowsky Winthrop Professor, School of Psychology, University of Western Australia Posted on 12 September 2012 Filed under Cognition |
 | and Klaus Oberauer |
Data integrity is a central issue in all research, and internet-based data collection poses a unique set of challenges. Much attention has been devoted to that issue and procedures have been developed to safeguard against abuse. There have been numerous demonstrations that internet platforms offers a reliable and replicable means of data collection, and the practice is now widely accepted.
Nonetheless, each data set must be examined for outliers and “unusual” responses, and our recent paper on conspiracist ideation and the motivated rejection of science is no exception.
Perhaps unsurprisingly, after various unfounded accusations against us have collapsed into smithereens, critics of our work have now set their sights on the data. It has been alleged that the responses to our survey were somehow “scammed,” thereby compromising our conclusions.
Unlike the earlier baseless accusations, there is some merit in casting a critical eye on our data. Science is skepticism and our data must not be exempt from scrutiny.
As it turns out, our results withstand skeptical scrutiny. We will explain why in a series of posts that take up substantive issues that have been raised in the blogosphere in turn.
This first post deals with the identification of outliers; that is, observations that are unusual and deserve to be considered carefully.
Outlier detection and identification
Let’s begin by examining the variable of greatest interest in our paper, namely the indicators for “conspiracist ideation,” which is the propensity to endorse various theories about the world that are, to varying extents, demonstrably unfounded and absurd (there are some reasonably good criteria for what exactly constitutes a conspiracy theory but that’s not at issue here).
The full distribution of our conspiracy score (summed across the various items using a 4-point scale ) is shown in the figure below. Ignore the vertical red line for now.
For simplicity we are ignoring the space aliens for now (which formed a different indicator variable on their own), so the observations below represent the sum across 10 conspiracies (remember that the "convenience" theories involving AIDS and climate science are omitted from this indicator variable for the reasons noted in the paper).
Thus, a person who strongly disagreed with all conspiracies would score a 10, and someone who strongly agreed with them all would score a 40.
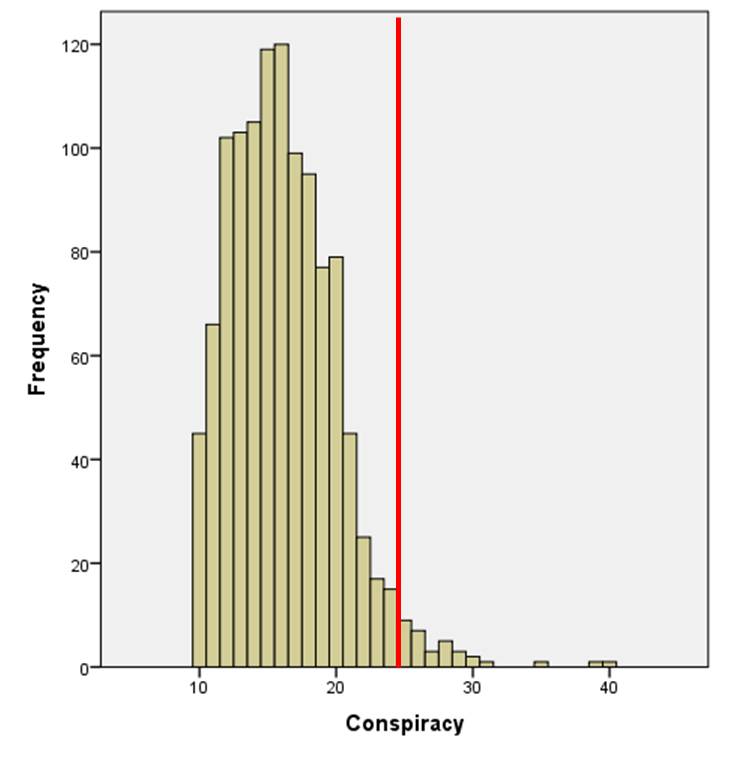
The figure invites several observations. First, the distribution is asymmetrical, with a longish upper tail. That is, most people tend to more or less reject conspiracies; their score falls towards the lower end of the scale.
Second there are several observations at the very top that may—repeat may—represent aberrant observations. It is those extreme scores that critiques of our data have focused on, for example the very thorough analysis by Tom Curtis. The top two extreme data points are indeed unusual. But then again, one might (just) expect a few such extreme scores in a sample of more than 1,000 people given the shape of the distribution.
So how does one deal with this situation?
The first, and most important step is the recognition that once the data have been obtained, any identification of an observation as an "outlier", and any decision to remove a subset of observations from analysis, almost inevitably involve a subjective decision. Thus, a valuable default stance is that all data should be retained for analysis. (There may be some clear-cut exceptions but the data in the above figure do not fall within that category).
There are two ways in which data analysts can deal with outliers: One is to remove them from consideration based on some criterion. There are many candidate criteria in the literature, which we do not review here because most retain an element of subjectivity. For our analysis, we therefore elected not to remove outliers by fiat, but we instead ensured that the inclusion or exclusion of any potential outliers has no substantive effect on the results.
That is, we examined the extent to which the removal of outliers made a difference to the principal result. In the case of our study, one principal result of interest involved the negative correlation between conspiracist ideation and acceptance of science. That is, our data showed that greater endorsement of conspiracy theories is associated with a greater tendency to deny the link between HIV and AIDS, lung cancer and tobacco, or CO2 emissions and global warming.
How resilient is this result to the removal of possible outliers?
The red line in the above figure answers that question. If all observations above that line (i.e., scores 25 or greater; there were 31 of those) are removed from the analysis, the link between the latent constructs for conspiracist ideation and rejection of climate science remains highly significant (specifically, the p-value is < .001), which means that the association is highly unlikely (less than 1 in 1000) to have arisen by chance alone.
In other words, if we discard the top 3% of the data, that is those part of the data which for conceptual reasons should arouse the greatest suspicion, our conclusions remain qualitatively unchanged.
Why discard anything above 25? Why not 29 or 30 or 18?
Because a score of 25 represents a person who disagrees with half of the theories and agrees with the other half (or some equivalent mix of strongly-agreeing and strongly-disagreeing responses). Lowering the cutoff further, thereby eliminating more observations, would eventually eliminate anyone who endorsed any of the theories—and guess what, that would defeat the whole point of the study. Conversely, there is no point in raising the cutoff because we already know what happens when all data are included.
We conclude with considerable confidence that when a highly conservative criterion (scores 25 or above) for outliers is used, the principal result remains qualitatively unchanged. Conspiracist ideation predicts rejection of science—not just climate science, but also the (even stronger) and even more strongly, rejection of the link between HIV and AIDS and the link between tobacco and lung cancer. [13/9: rephrased to clarify, the 'more strongly' refers to magnitude of regression weights.]
How does the elimination of outliers relate to the notion of “scamming”, which has stimulated so much interest in our data?
The answer is both obvious and also quite subtle: The obvious part is that the two folks at the very top of the above distribution strongly endorsed virtually all conspiracy theories. If they then also strongly rejected climate science, that would arguably constitute a profile of scamming—that is, those folks may have generated responses to create the appearance that “deniers” are “conspiracy nuts” (note the quotation marks: this discussion is almost impossible to write succinctly without labels, even if they are caricatures).
Now, we have dealt with the obvious bit about the "scamming" problem by throwing out not just those two people of greatest concern, but the top 3% of the distribution—that is, anyone who might remotely look and act like a “scammer” based on their responses to 10 conspiracy theories.
Remember—none of the significant correlations in our data disappear when those people are removed from consideration.
But now to the more subtle part: How would we know that someone who endorses all conspiracy theories but none of the science is actually a scammer? We have tacitly assumed that this somehow is evidence of scamming. But on what basis? Is there more to this than intuition?
This brings us to the fascinating issue of mental models of people's behavior, which we will address in a future post.
![]()
107 Comments
Comments 101 to 105 out of 105:
Post a Comment

 |
No Current Events PlannedRelevant events (mainly in Australia) will be announced here as they become available. |
|